VISIONS 3.40

click image to enlarge

Beginning in 2002, Ron Groenke started developing a computer program to assist with his trading decisions. When he wrote his first book, The Money Tree, elements of the current program were made available. With each successive book, the computer program, VISIONS, grew in capabilities and functions. Now, in 2016 Ron has issued the latest update, VISIONS V3.40.


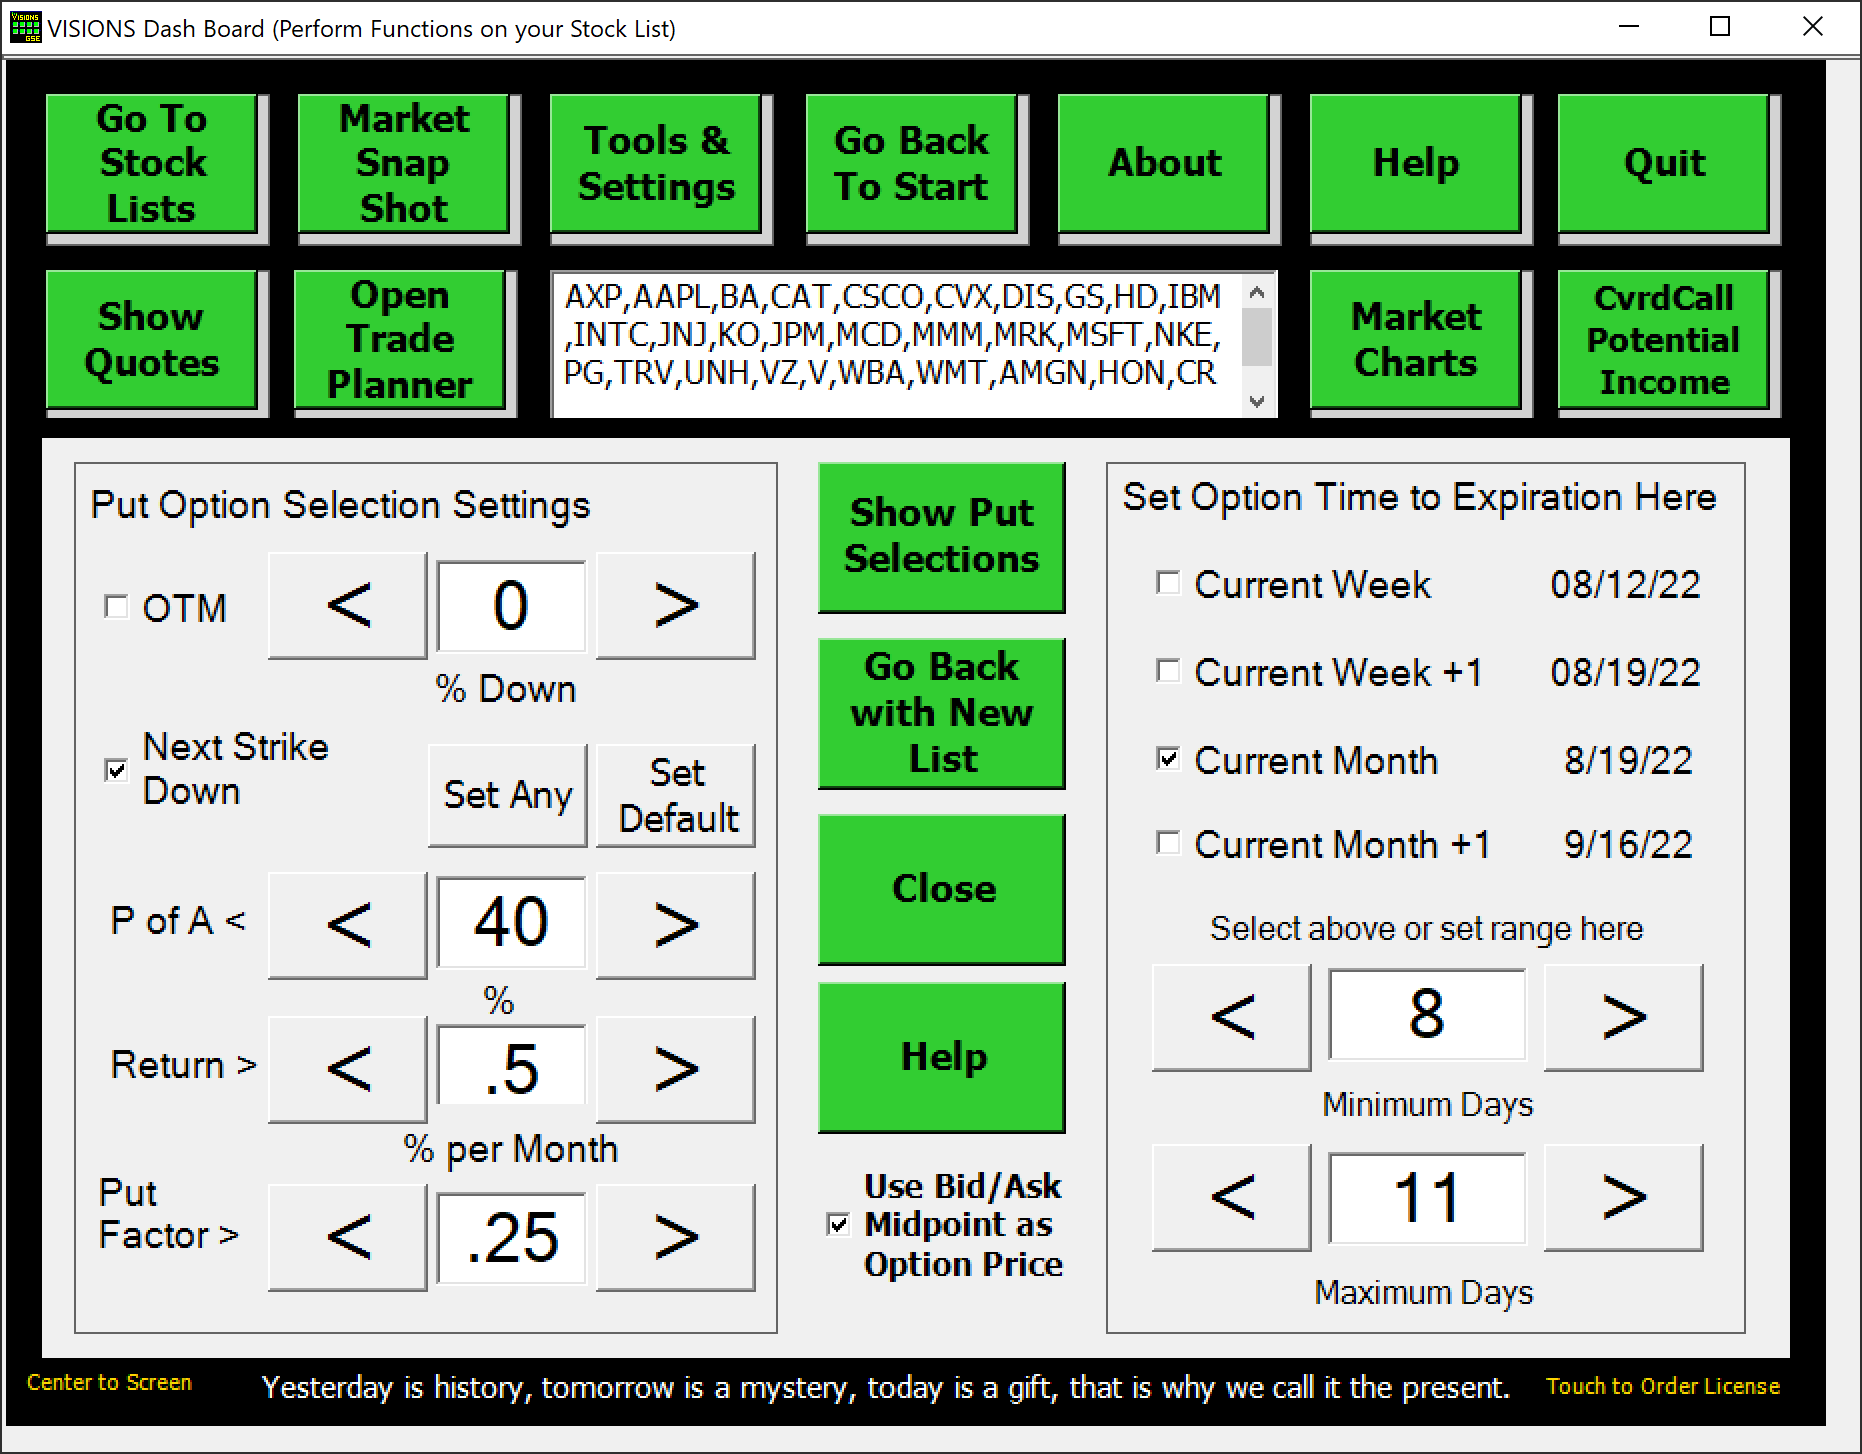
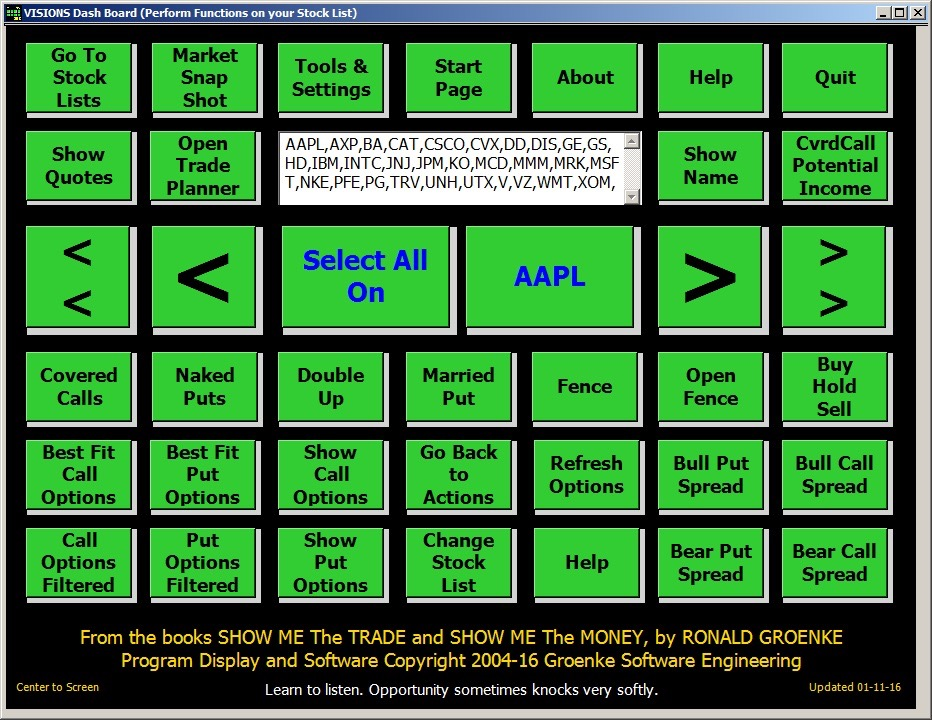
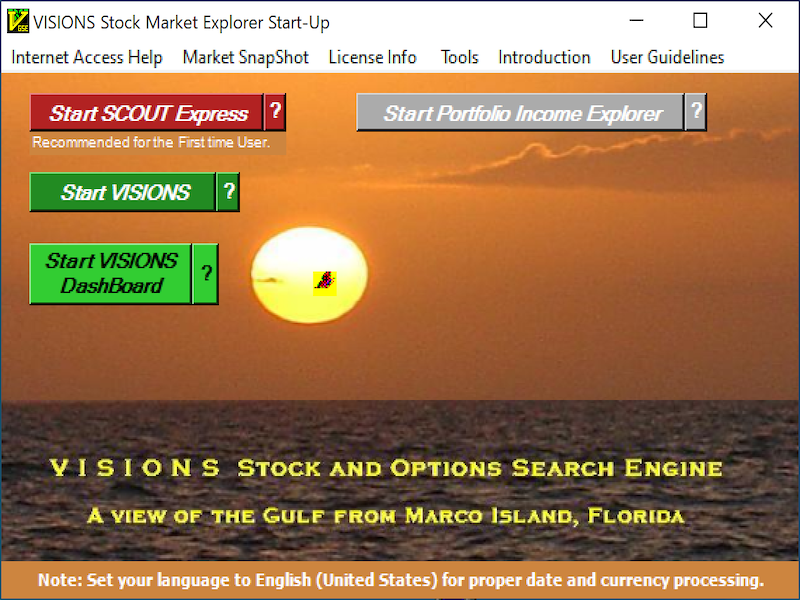
VISIONS V3.40 has all the past VISIONS capabilities plus a new Dashboard geared to the new Windows 10 touch environment. The classic version of VISIONS is accessible using the Start VISIONS green button. The new interface is accessible using the Start VISIONS Dashboard. With the Dashboard, you get the ease of use provided by the touchscreen technology. You can literally just touch your way into finding great covered call and naked put opportunities.

VISIONS V3.40 eliminates the drudgery of looking for the financial information for the companies that you might want to add to your prospect list. Some of the features include:

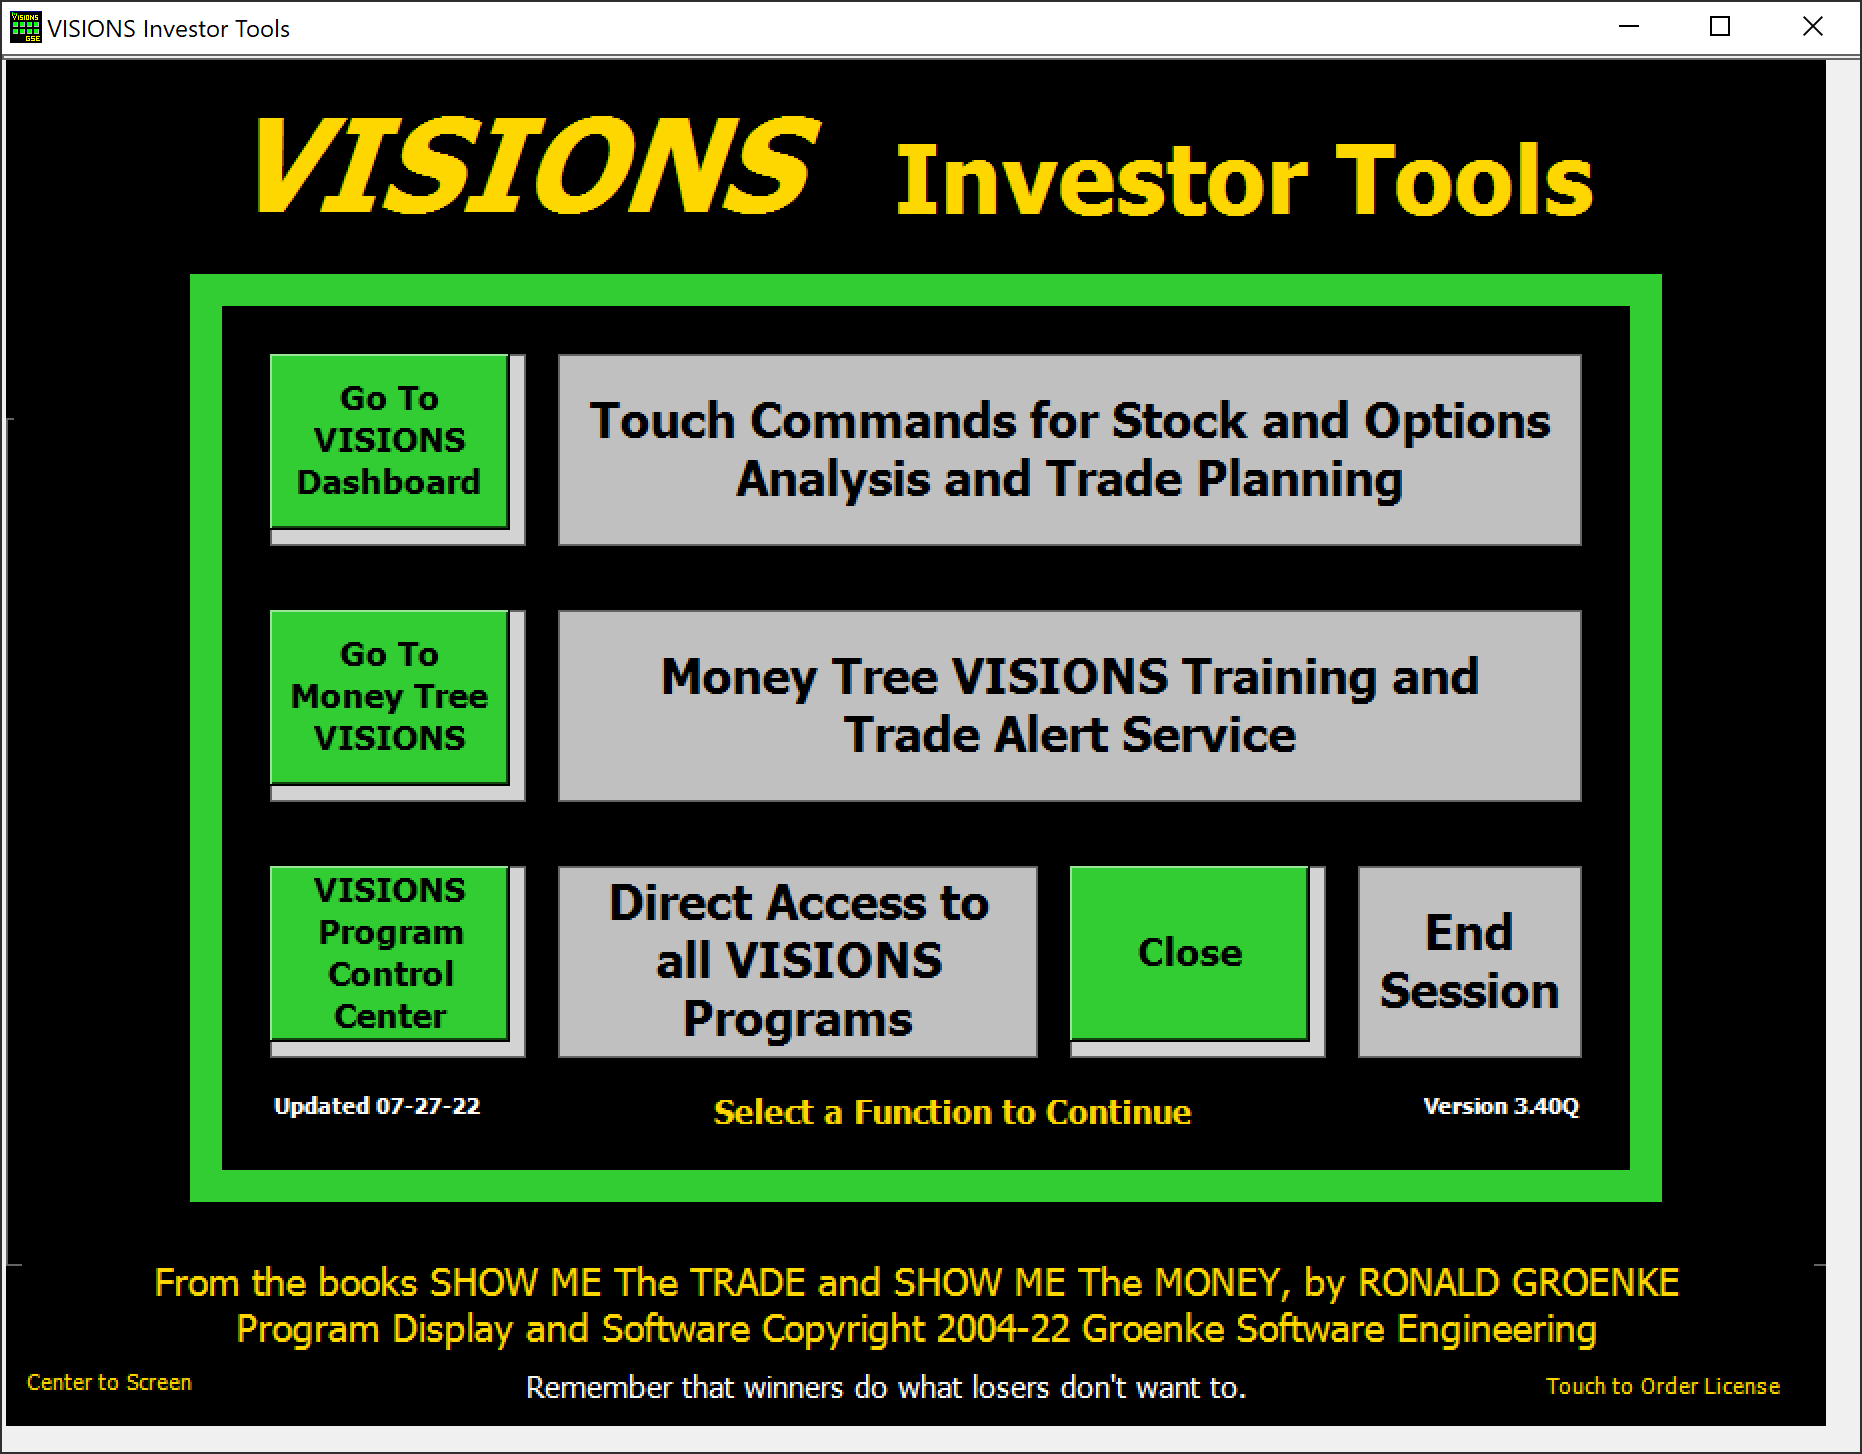
VISIONS V3.40 START PAGE

The interface from V3.30 to V3.40 has dramatically changed. This gateway to the program features and capabilities is used to unlock several search engines. 

click image to enlarge

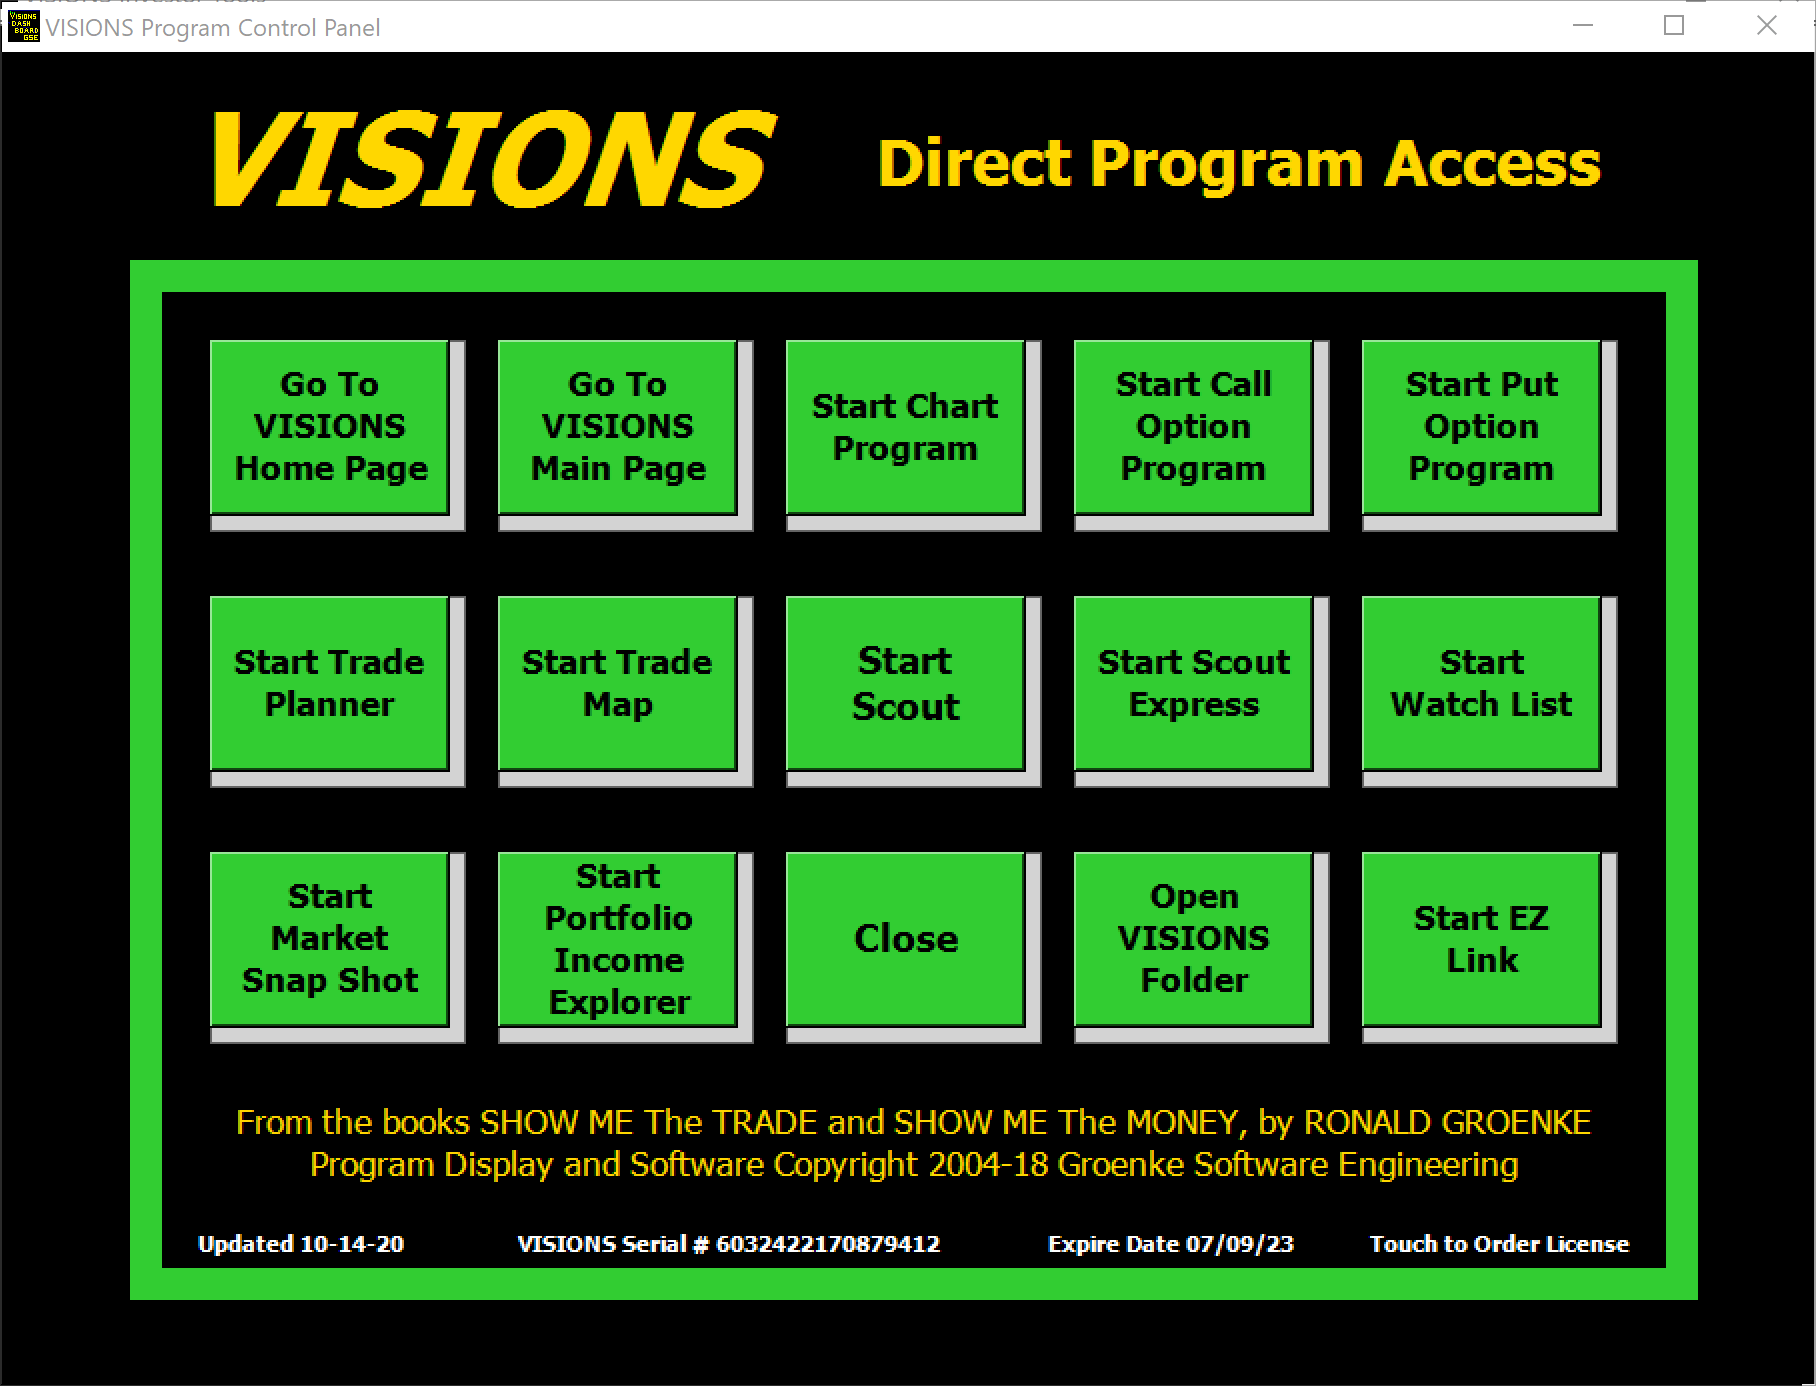
DIRECT PROGRAM ACCESS

To help the long-time VISIONS user, there is the ability to directly access the familiar VISIONS modules and features. This interface is provided to have some backward capability for those users which have learned the V3.30 program and are not looking to upgrade. It also can be used to help the Windows 7 and Windows 8 users that are seeking the old interface. However, just because you don’t have the Windows 10 touchscreen devices, you can still use the the new interface with older Windows operating system – with your mouse in a point and click manner.

click image to enlarge

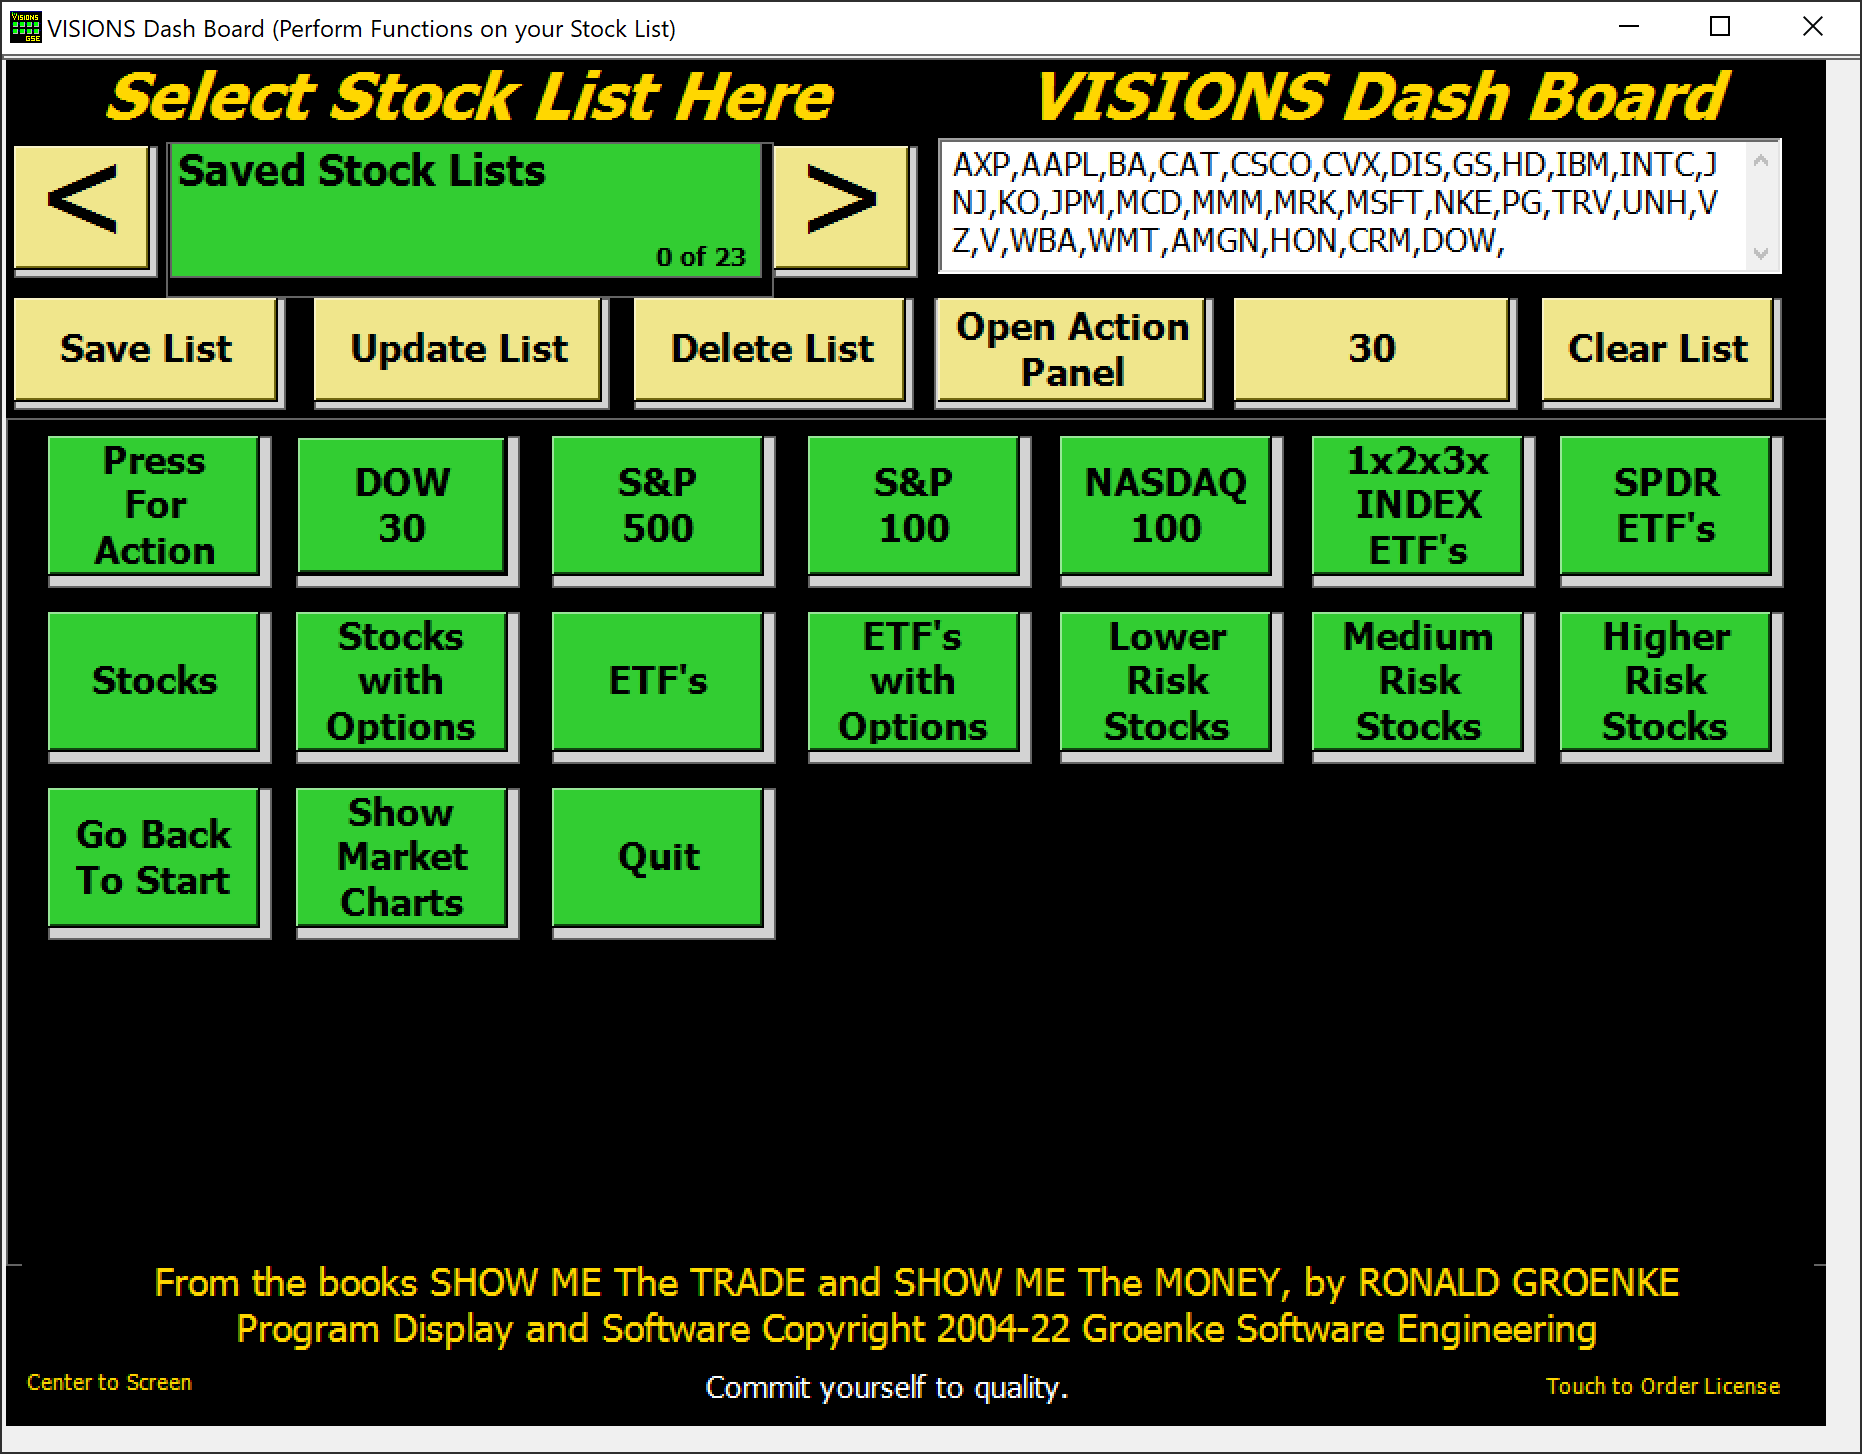
SELECT STOCK LIST

With VISIONS you can select a predefined index list of stock or ETFs to begin your search for good investing opportunities. The Stock List panel is part of the VISIONS Dash Board, the main interface tool. If you don’t want to use one of the predefined lists, you can create and save your own list of favorite equities.

click image to enlarge

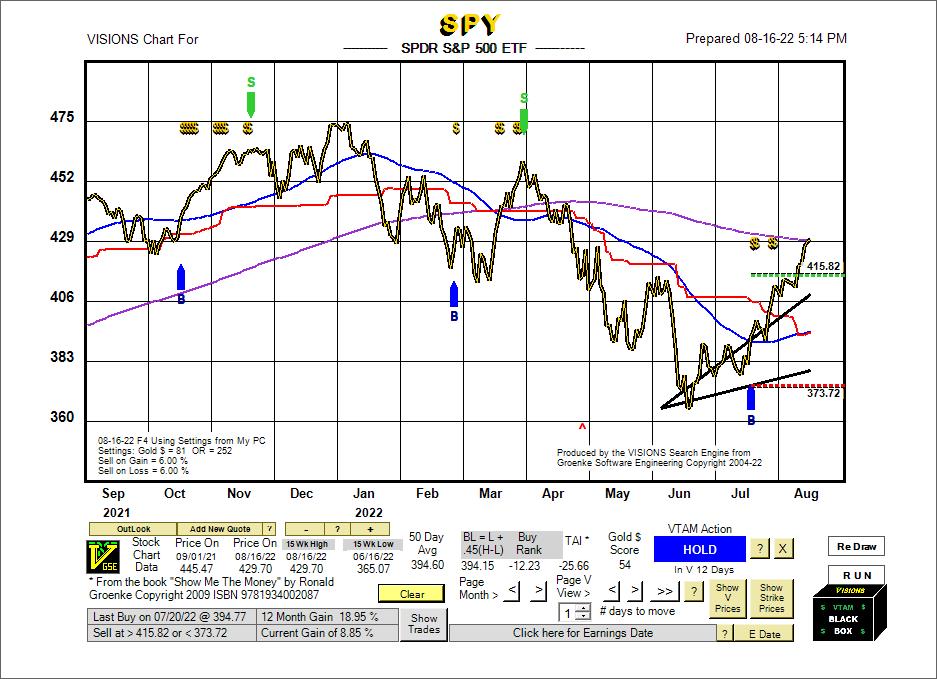
THE STOCK CHART SEARCH ENGINE

Displays a 12 month view of the stocks on your list together with their Buy Limit, 30, 50, 100, or 200 day moving average, and comparison with the major indexes such as the DJIA, SP500, SP100, NASDAQ, or Russell 2000. Provides a take action indicator with number of days in the VISIONS View V. Charts are saved for use at any time.  VTAM (VISIONS V Technical Analysis Model) is embedded within the Chart Search Tool to determine the optimum Wait/Buy/Hold/Sell signal for best yearly return. The optimization process will find the sell on gain and sell on loss price that is unique for the equity. The signal settings are reset anytime a Wait condition is indicated. Each stock has is own chart settings for optimum return with highest probability of success.
click image to enlarge

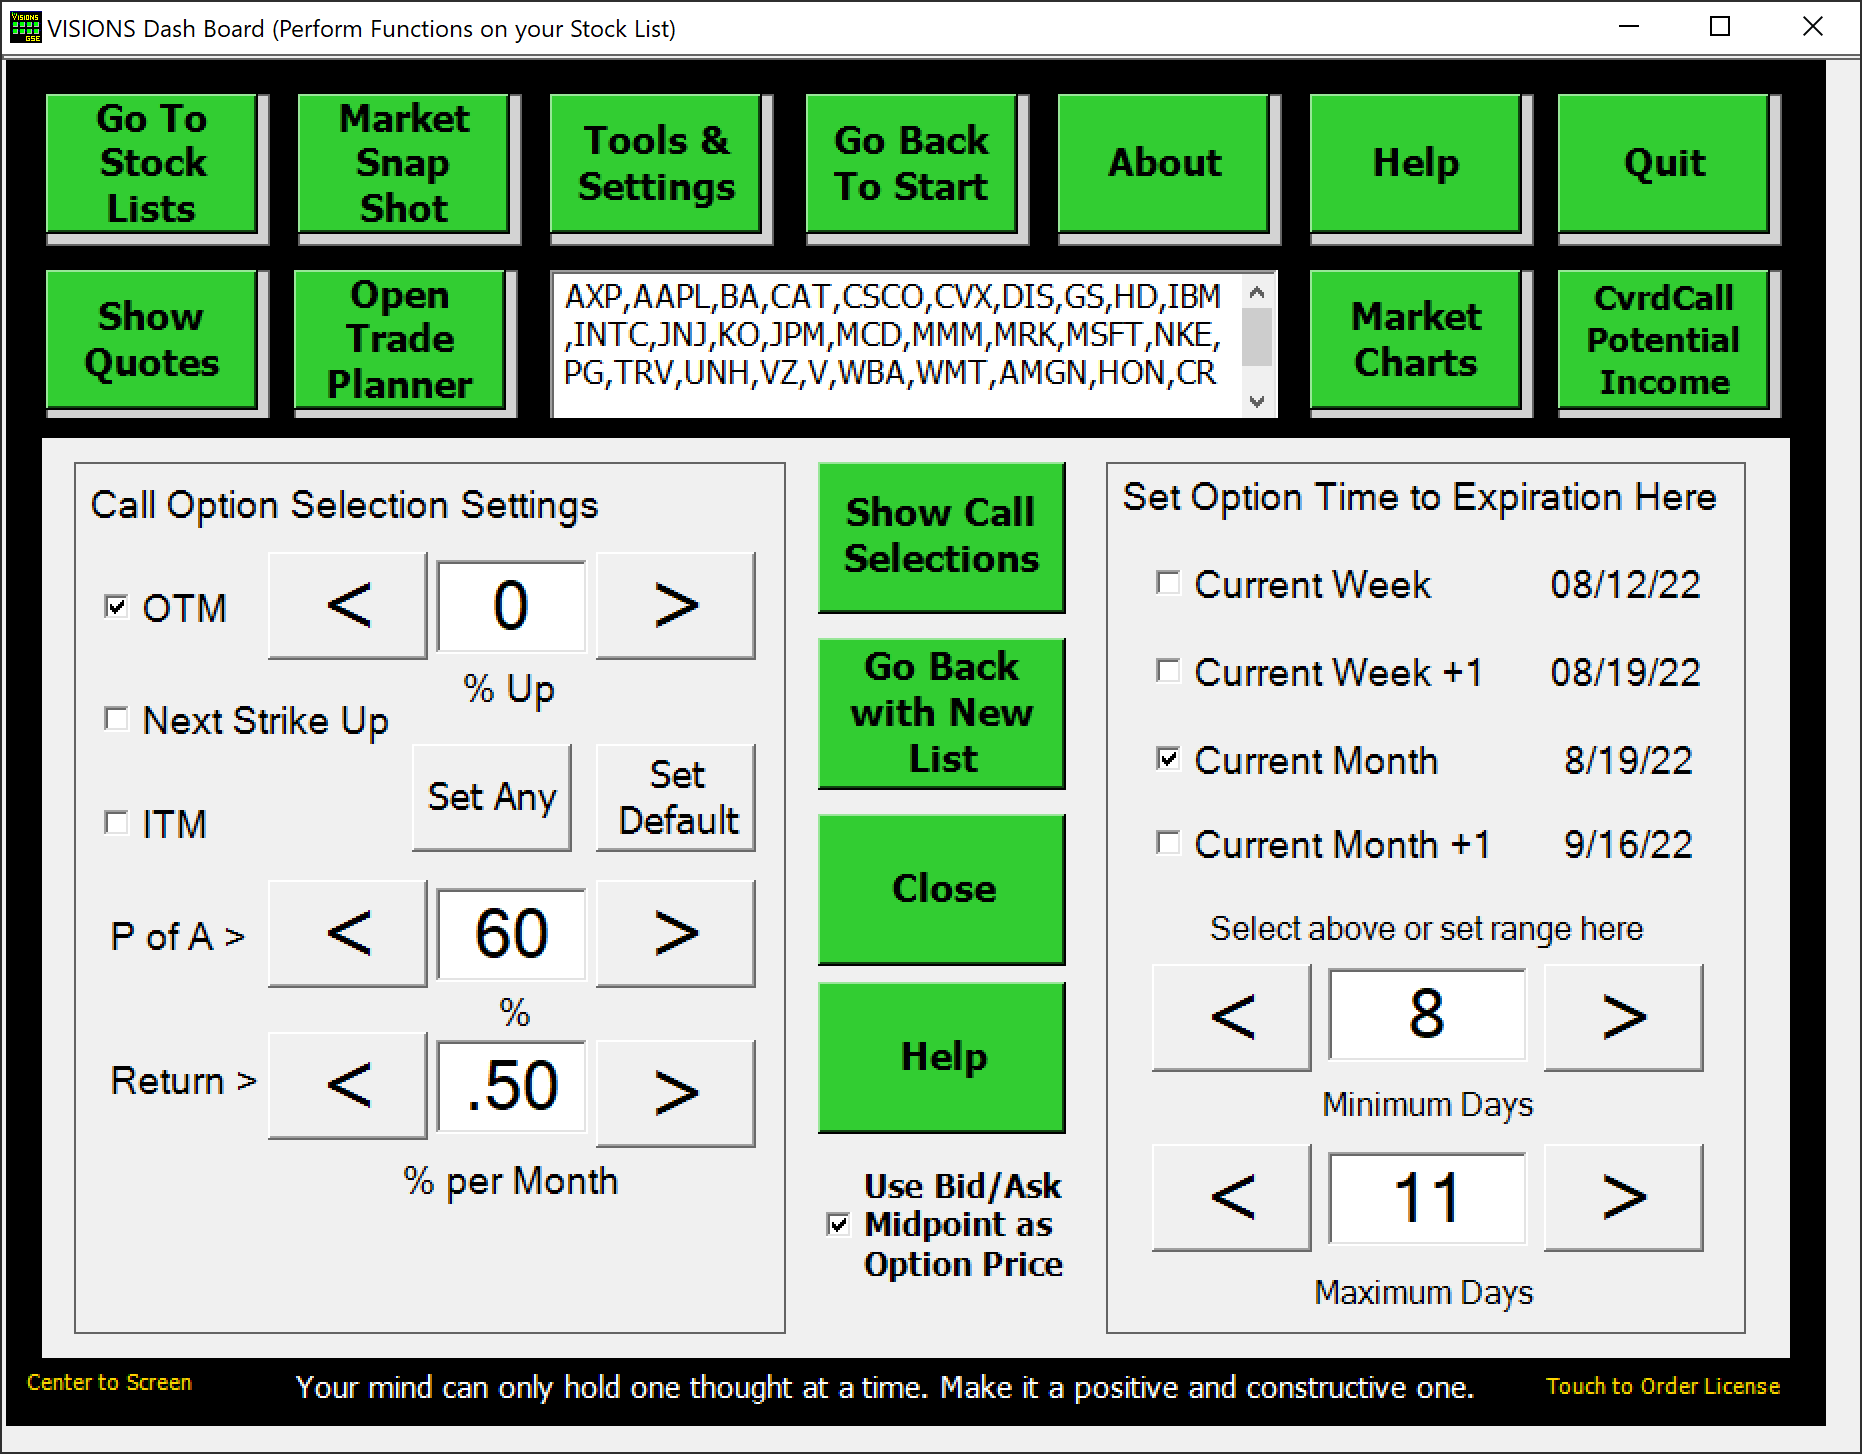
THE CALL OPTION SEARCH ENGINE

Displays the call options that meet your strike month, % gain, and premium criteria. It also provides the current price, the 52 week trading range, 50 day average, Buy Limit, Buy Rank, TAI, and Beta. A best fit to the Magic Chart is calculated along with percent gain for If-Sold and If-Expired, and months to expiration. Creates a summary of all the options sorted by best If-Sold % gain from all the stocks in your search list.
click image to enlarge

THE PUT OPTION SEARCH ENGINE

Displays the put options that meet your strike month, Put Factor, and premium criteria. It also provides the current price, the 52 week trading range, 50 day average, Buy Limit, Buy Rank, TAI, and Beta. A best fit to the Put Factor is calculated along with % discount and months to expiration. Creates a summary of all the options sorted by best Put Factor from all the stocks in your search list.
click image to enlarge

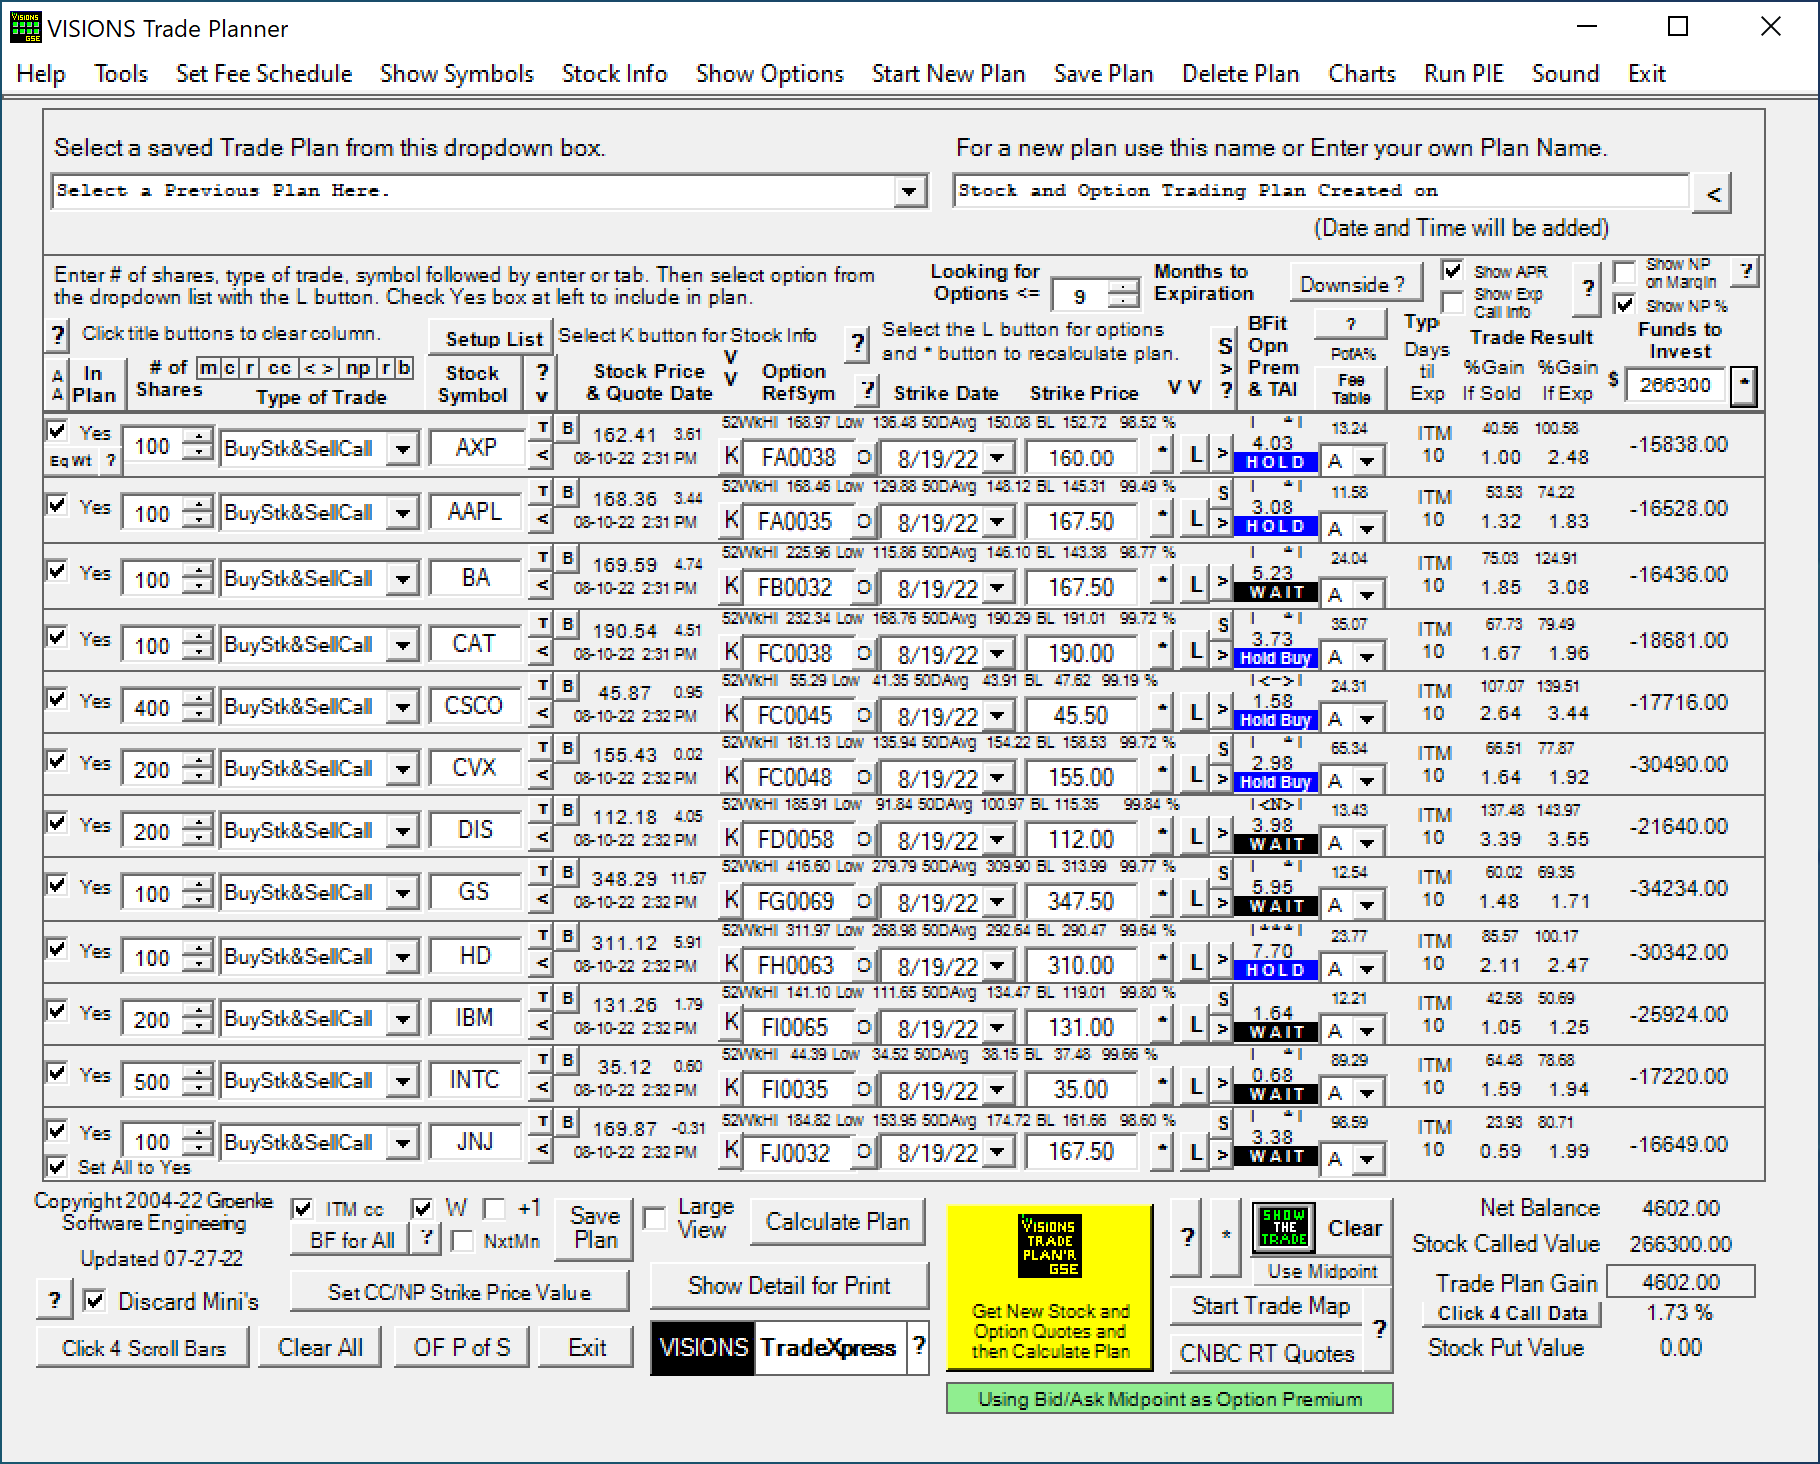
THE TRADE PLANNER

Many VISIONS users have found this tool to be the greatest part of the software. With it’s ability to get call and put premiums, combined with the selection of a trade strategy, it is the heart of developing a plan for your trading. This tool allows you to prepare a plan for executing a number of Covered Calls and Naked Puts. Spreads and other advanced option trades and be analyzed to determine the probability of success. You can review the overall results (% gain) on your current stock and option selections. You can save and print the plan at any time.
click image to enlarge

TRADE ANALYSIS PAGE

This tool prepares trades for eleven different trade strategies as described in the book Show Me The Trade. Each trade is optimized for the best return in the shortest time possible with highest probability of success.
click image to enlarge

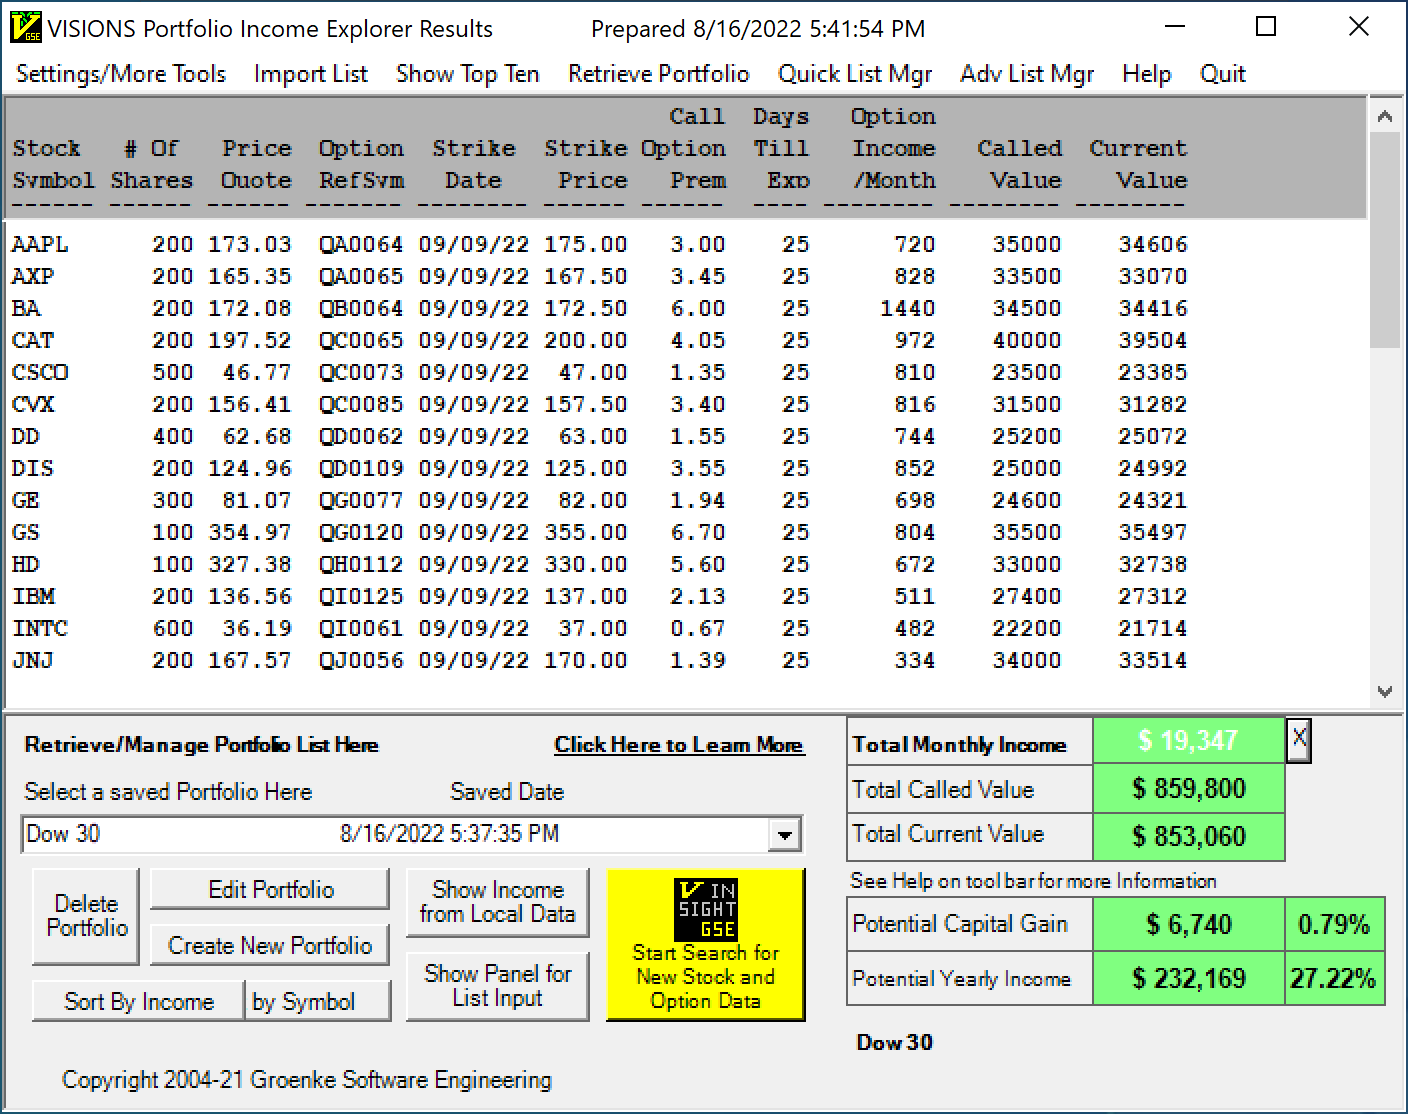
THE VISIONS PORTFOLIO INCOME EXPLORER

The VISIONS PIE program has been replaced with the CvrdCall Potential Income button. It allows you to find out how much income you can generate from your stock portfolio on a monthly basis. It is based on the next month best call option available, and can be configured to look at other time frames.
click image to enlarge
s2Member®